🔒 Important Message: Concerns about data privacy and sensitive client information prevent the dataset's features, attributes, and records from being displayed. The offered sample code is only intended for your comprehension and familiarity.
Sensor Fault Detection IOT Devices
Completed on 03-02-2023

Problem Statement
The main objective is significantly reducing or minimizing the downtime and increase operational efficiency through the use of machine-learning technique. It will be feasible to forecast whether or not equipment controller cards will fail using this technology. Essential components of the transmission equipment used in the telecommunications industry are equipment controller cards. Ultimately, the utilization of these predictive analytics will improve end user service quality and enable seamless communication or efficiency.
Tech Stacks
Python
Machine Learning
Pandas
Numpy
Seaborn
Matplotlib
Scikit Learn
Pickle
Git
GitHub
MongoDB
CI/CD
Docker
AWS
Technologies listed above were utilized to implement the solutions for this project.
Sources of Data
Cloud AWS
Databases
Explain the Dataset Size and Composition
The dataset total of 4 datasets that were collected from different sources, such as databases, and cloud. In total, these datasets contain approximately 6 million records that were gathered over a one-year period. The volume of the data collection is 120 megabytes.
Workflow Architecture
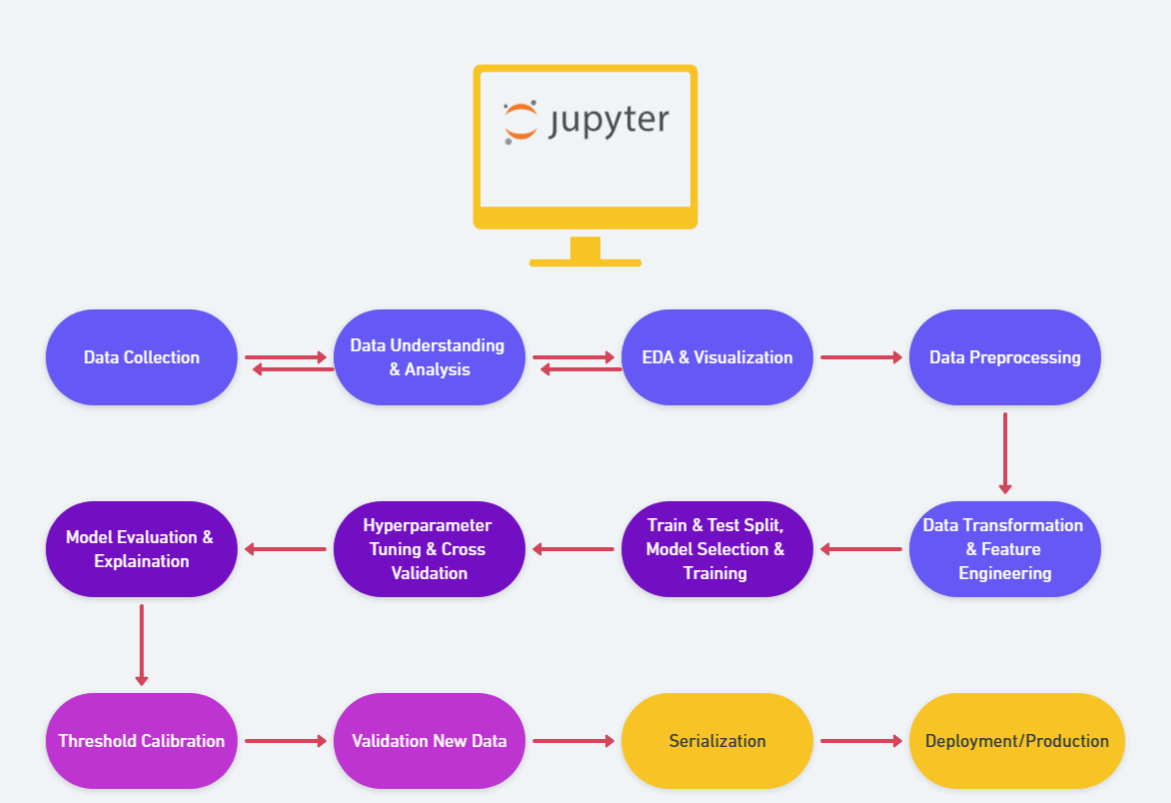
These steps are involved in developing and implementing this project are described in the architecture below.


Data Collection
- It involves obtaining a un-processed raw data from a different of sources, such as databases, Google Drives, APIs, and the cloud
API Data Collection:
        import pandas as pd
        import requests

        def fetch_data_from_api(api_url):
            response = requests.get(api_url)
            data = response.json()
            df = pd.DataFrame(data)
            return df

        # Example API URL
        api_url = 'https://api.example.com/data'  # Replace with your API URL
        api_data = fetch_data_from_api(api_url)
        print("Data from API:", api_data.head())
Google Drive Data Collection:
        import io
        from google.colab import auth
        from googleapiclient.discovery import build

        def fetch_data_from_google_drive(file_id, creds_file):
            auth.authenticate_user()
            drive_service = build('drive', 'v3')
            request = drive_service.files().get_media(fileId=file_id)
            file = io.BytesIO(request.execute())
            df = pd.read_csv(file)
            return df

        google_drive_file_id = 'YOUR_GOOGLE_DRIVE_FILE_ID'  # Replace with your file ID
        google_creds_file = 'path/to/your/credentials.json'  # Replace with your credentials file path
        google_drive_data = fetch_data_from_google_drive(google_drive_file_id, google_creds_file)
        print("Data from Google Drive:", google_drive_data.head())
Credentials should not be hardcoded.
Data Cleaning
Deleting information that is unnecessary or inaccurate, such as duplicates, invalid entries, and missing values.
imputation or removal of missing values in accordance with the context of the data.
      import pandas as pd

      # Load your dataset
      df = pd.read_csv('path/to/your/dataset.csv')

      # Drop duplicates
      df = df.drop_duplicates()

      # Fill missing values
      df = df.fillna(method='ffill')  # Forward fill example

      # Drop rows with missing values
      df = df.dropna()

      print("Cleaned Data:", df.head())
Feature Engineering
Creating new features or transforming existing features to improve model performance.
      import pandas as pd

      # Load your dataset
      df = pd.read_csv('path/to/your/dataset.csv')

      # Create a new feature
      df['new_feature'] = df['existing_feature'] * 2  # Example transformation

      print("Data with New Feature:", df.head())
Exploratory Data Analysis (EDA)
Analyzing data to understand patterns, trends, and relationships using statistical summaries and visualizations.
      import pandas as pd
      import matplotlib.pyplot as plt

      # Load your dataset
      df = pd.read_csv('path/to/your/dataset.csv')

      # Summary statistics
      print("Summary Statistics:", df.describe())

      # Plotting
      plt.figure(figsize=(10, 6))
      df['column_name'].hist(bins=30)
      plt.xlabel('Column Name')
      plt.ylabel('Frequency')
      plt.title('Histogram of Column Name')
      plt.show()
Hyperparameter Tuning
Adjusting hyperparameters of the model to improve performance.
Example using Grid Search Cross-Validation (GridSearchCV):
      from sklearn.model_selection import GridSearchCV
      from sklearn.ensemble import RandomForestClassifier

      # Define the model and parameters
      model = RandomForestClassifier()
      param_grid = {
          'n_estimators': [100, 200],
          'max_depth': [10, 20],
      }

      grid_search = GridSearchCV(model, param_grid, cv=5)
      grid_search.fit(X_train, y_train)

      print("Best Parameters:", grid_search.best_params_)
Cross-Validation
Splitting the dataset into multiple folds to ensure the model's performance is robust and generalizable.
      from sklearn.model_selection import cross_val_score

      # Cross-validation
      scores = cross_val_score(grid_search.best_estimator_, X, y, cv=5)
      print("Cross-Validation Scores:", scores)
      print("Mean CV Score:", scores.mean())
SHAP Explainer
Explaining model predictions using SHAP (SHapley Additive exPlanations) values to understand feature contributions.
      import shap

      # SHAP Explainer
      explainer = shap.TreeExplainer(grid_search.best_estimator_)
      shap_values = explainer.shap_values(X_test)

      # Plot SHAP values
      shap.summary_plot(shap_values, X_test)
Model Threshold Calibration
Adjusting the classification threshold to balance precision and recall according to business requirements.
      from sklearn.metrics import precision_recall_curve

      # Predictions and thresholds
      y_scores = grid_search.best_estimator_.predict_proba(X_test)[:, 1]
      precision, recall, thresholds = precision_recall_curve(y_test, y_scores)

      # Plot Precision-Recall Curve
      plt.figure(figsize=(10, 6))
      plt.plot(thresholds, precision[:-1], label='Precision')
      plt.plot(thresholds, recall[:-1], label='Recall')
      plt.xlabel('Threshold')
      plt.ylabel('Score')
      plt.title('Precision-Recall vs Threshold')
      plt.legend()
      plt.show()
Model Evaluation
Assessing the model's performance using metrics such as accuracy, precision, recall, and F1 score.
      from sklearn.metrics import classification_report, confusion_matrix

      # Confusion Matrix
      conf_matrix = confusion_matrix(y_test, y_pred)
      print("Confusion Matrix:", conf_matrix)

      # Classification Report
      class_report = classification_report(y_test, y_pred)
      print("Classification Report:", class_report)
Validation with New Data
Evaluating the model's performance on new, unseen data to assess its generalizability.
      # Load new data
      new_data = pd.read_csv('path/to/new/data.csv')

      # Process new data (e.g., feature engineering)
      new_data_processed = new_data[['feature1', 'feature2']]

      # Predictions on new data
      new_predictions = grid_search.best_estimator_.predict(new_data_processed)
      print("Predictions on New Data:", new_predictions)
Deployment
Implementing the model in a production environment where it can make predictions on new data.
      import pickle

      # Save model
      with open('model.pkl', 'wb') as file:
          pickle.dump(grid_search.best_estimator_, file)

      # Load model
      with open('model.pkl', 'rb') as file:
          loaded_model = pickle.load(file)

      # Example prediction
      sample_data = [[1, 2]]
      prediction = loaded_model.predict(sample_data)
      print("Prediction:", prediction)
Summary
In order reduce operational inefficiencies and downtime, the work aims to use machine learning to predict equipment controller card failure. This cards are most imortant parts of the transmission equipment used in the telecom industry. Using predictive analytics is to foresee these problems and make the necessary corrections in advance, which will improve end-user service quality by ensuring uninterrupted interaction. Finally this method will provide a more reliable means for the communications infrastructure to operate, it will likely result in improved performance and increased customer satisfaction.